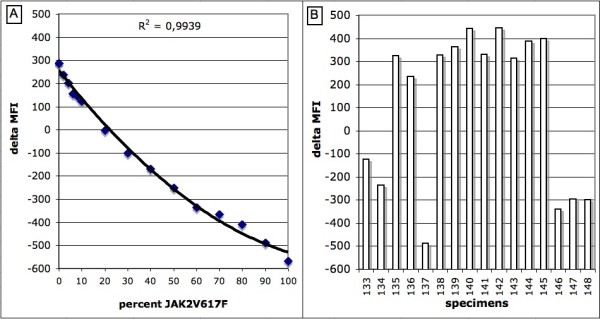
Figure 5.

Polynomial graphic representation of the standard curve (A) and quantitative detection of JAK2V617F from specimens (B). Typical representation of the delta MFI curves and bar graphs applied to the detection of JAK2V617F variant from specimens. The percentage of mutated alleles is determined by comparing the height of the bar graphs from specimens with the standard curve. The equation is Y = 0.0473X2-12.6X+256.
