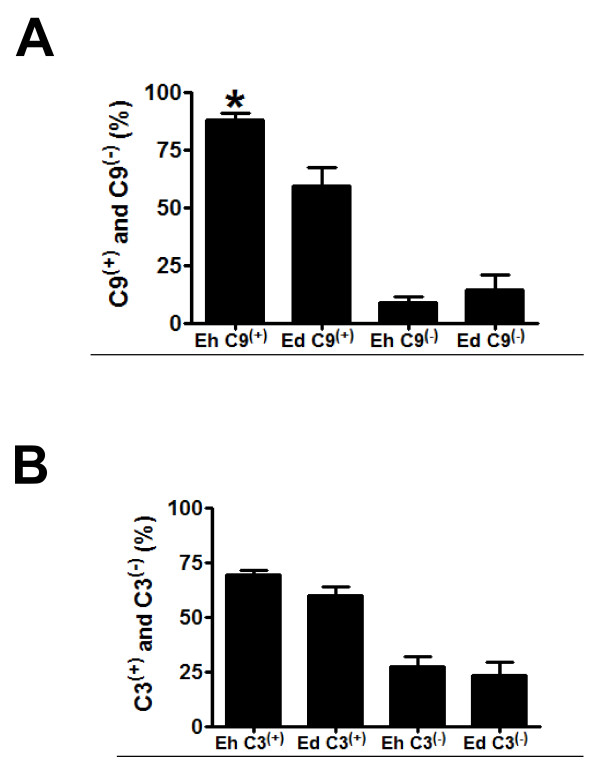
Figure 5.
Quantification of C3 and C9 complement. (a) Distribution of C9(+) and C9(-) trophozoites and (b) C3(+) and C3(-) trophozoites in liver of hamsters infected with E. histolytica or E. dispar. Data is expressed as percentage of the positive and negative numbers of trophozoites and shown as means ± SEM. * p < 0.05 vs. E. dispar C9(+)trophozoites.

