
Fig. 2.
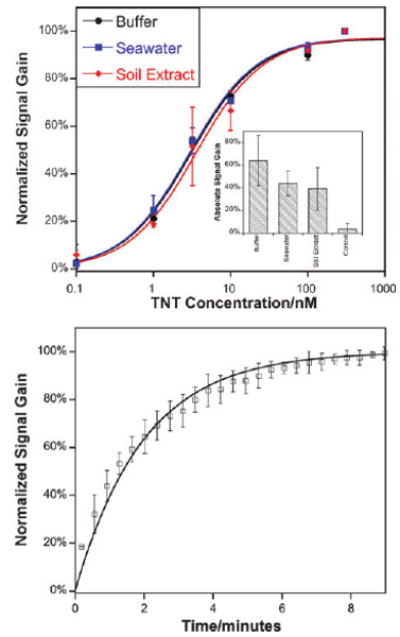
(Top) As shown, the E-DNA scaffold readily detects protein–small molecule interactions even in complex samples such as seawater and crude soil extracts. The concentrations of half maximal inhibition (IC50) observed in these complex sample matrices are within error of the 3.1 ± 0.5 nM observed in buffer. Data represent titrations normalized to the same final signal gain. The inset shows the average absolute signal gain for each condition.15 (Bottom) The assay is rapid; shown are normalized sensor responses of three independently fabricated sensors upon the addition of 50 nM TNT. The error bars in these panels and the following figure represent the standard deviation of three electrodes and are dominated by inter-electrode variability.