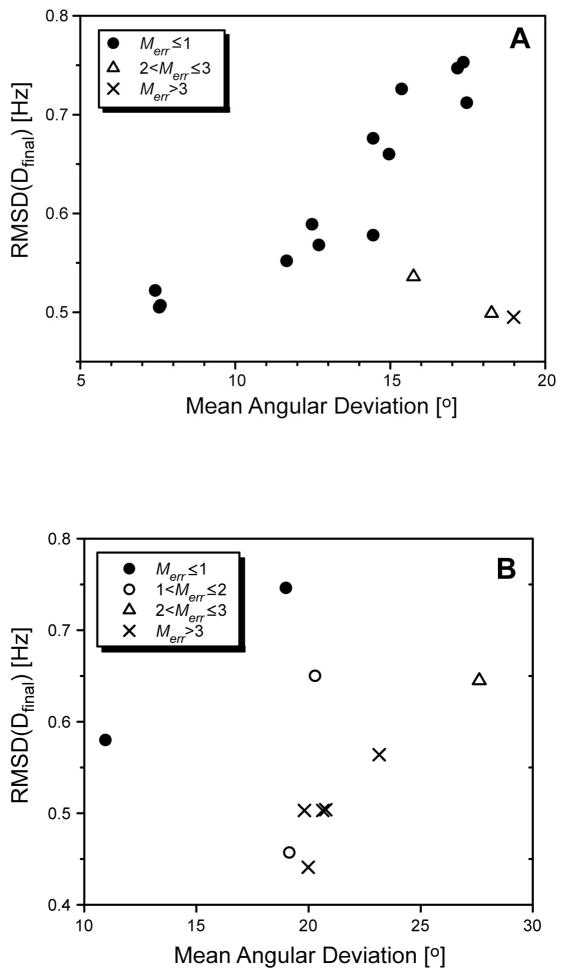
Figure 3.
Plot of the mean angular deviation of final vector orientations from actual orientations versus the corresponding RMSD between the synthetic and the calculated RDCs. Results shown are for test cases using synthetic RDCs derived either from a set of randomly generated vector orientations (N = 100, σD = 1.0 Hz) (A) or from X-ray structural coordinates of Calmodulin (Chattopadhyaya et al. 1992) (PDB 1CLL) (B) For the calmodulin case, the effects of dynamic averaging was included as follows: 18% of vectors were assigned generalized order parameters S between 0.4 and 0.8 while the other 82% had S values lying between 0.8 and 1.0.

