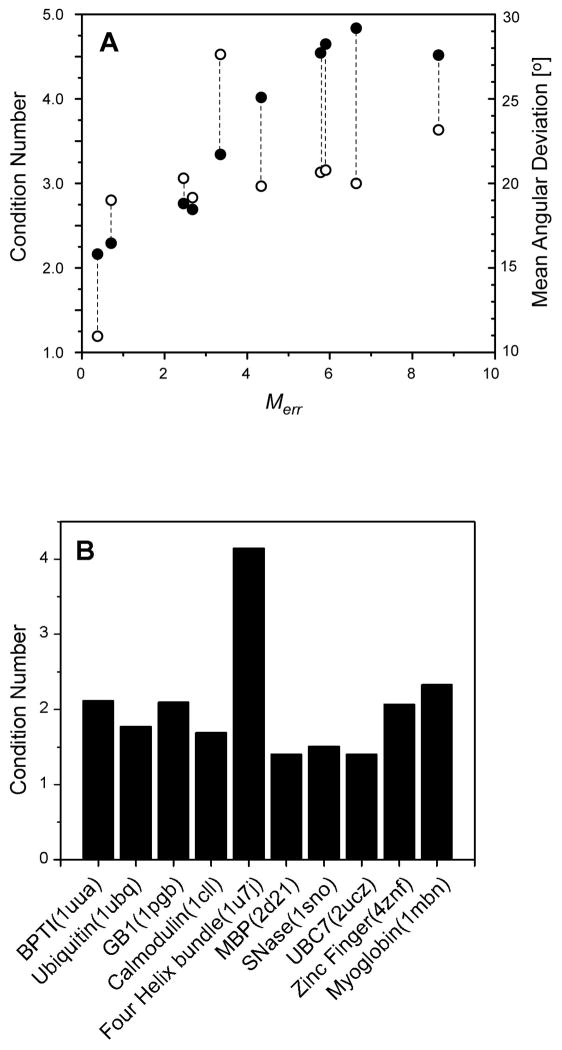
Figure 4.
(A) Correlation plot of Merr versus the condition number of the matrix B (●) and the mean angular deviation of vector orientations from their true values (○) for each of the ten unique solutions obtained in the RSDC test case using synthetic calmodulin data with dynamics added (see text). The dotted lines denote that two different correlations are being displayed for each RSDC solution. (B) Calculated condition numbers for the B matrix constructed using all amide N-H bonds taken from the indicated PDB entry. The condition number is the ratio of the largest to smallest singular values resulting from a singular value decomposition (SVD) of the matrix B formed as described in the text.

