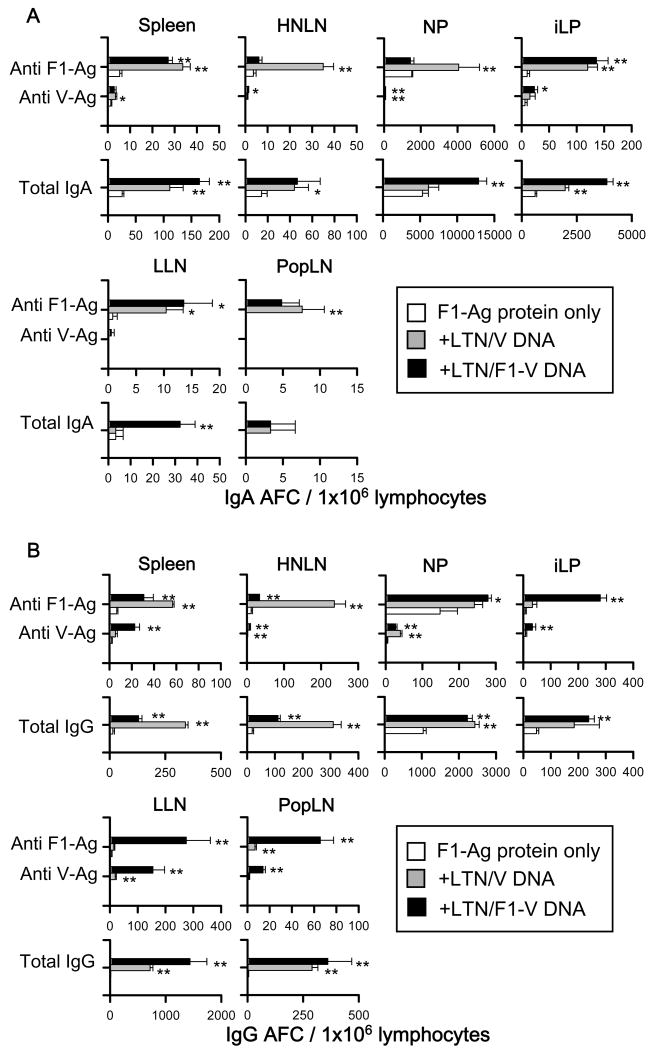
Fig. 7.
IgA (A) and IgG (B) Ab-forming cell (AFC) responses by mice i.m. vaccinated with LTN/F1-V or LTN/V DNA vaccine. Mice were i.m. immunized with DNA vaccines and nasally boosted with F1-Ag protein, as described in Fig. 4, and lymphoid tissues were isolated on wk 14. Total splenic, HNLN, NP, iLP, lumbar lymph node (LLN), and popliteal lymph node (PopLN) mononuclear cells were isolated from each DNA vaccine group (5 mice/group/experiment) and evaluated in a B cell ELISPOT assay to assess F1-Ag- and V-Ag-specific and total (A) IgA and (B) IgG AFCs. Depicted is the mean ± SEM of AFC responses taken from two experiments. Significant differences comparing with F1-Ag protein immunization only group are shown as *P < 0.05 and **P < 0.01.

