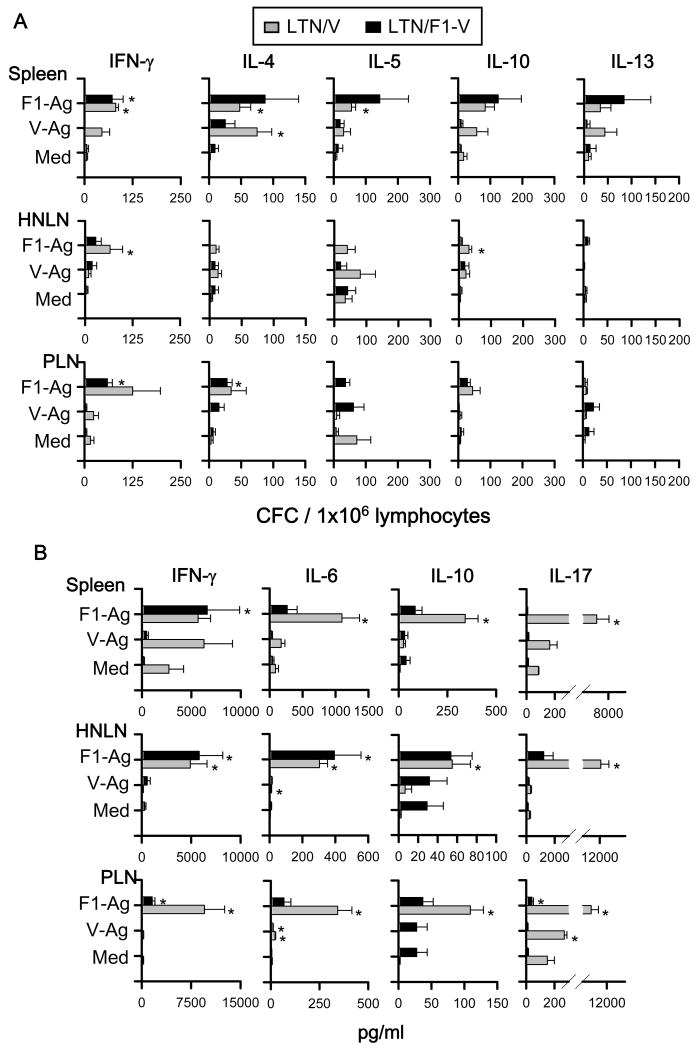
Fig. 9.
Cytokine responses cell by i.m. LTN/V-Ag or LTN/F1-V DNA primed-mice show Ag-specific Th1/Th2/Th17 cell responses. BALB/c mice were dosed i.m. with the DNA vaccine with nasal F1-Ag boost, as described in Fig. 4. On wk 14, total lymphocytes were isolated from spleens, HNLNs, and peripheral lymph nodes (PLNs), containing LLNs and PopLNs, and Ag-pulsed for 2 days; and (A) CFC responses and (B) cytokine production were measured by cytokine-specific ELISPOT and sandwich ELISA, respectively. Depicted is the mean ± SEM of two experiments (16 mice/group). In some instances, significant differences in the different tissues were detected compared to media (Med) (*P < 0.05).

