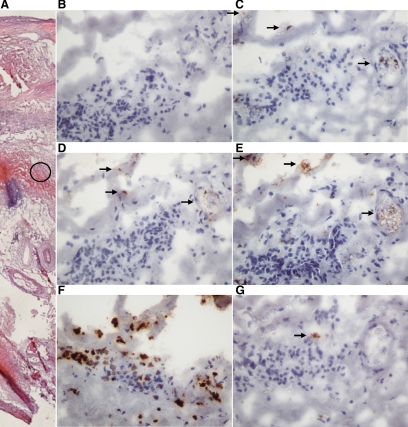
Figure 3.
Examples of high power (×40) photomicrographs of staining for CCL22 (D), CCR4 (E), macrophages (C), neutrophils (F), and mast cells (G) in a biopsy from the body of an AAA. Also shown is an H&E-stained section of the biopsy to illustrate the region the high power images are taken from highlighted with a black circle (A). B: Negative control using an isotype control Ab. Arrows indicate stained areas.

