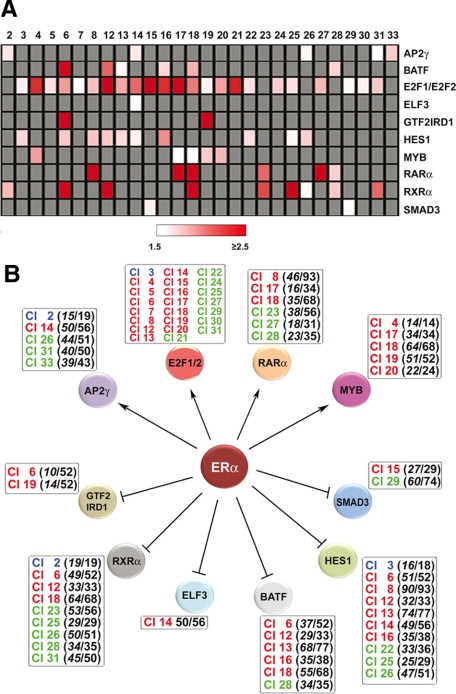
Figure 6.
An ERα-dependent gene regulation network in estrogen-stimulated breast cancer cells. In A the results of TFBS matrix enrichment (overrepresentation) analysis of the promoter region (−2000/+800 from the transcription startsite) of genes belonging to each estrogen-responsive gene cluster from Figure 1, A and B, are reported. The analysis was limited in this case only to TFs encoded by primary estrogen target genes from Figure 5, A and B. Z score cut-off was 3.0 and TFBSs showing an overrepresentation score ≥1.5 in at least one of the gene clusters are reported. Only clusters where at least one matrix scored above these thresholds are shown, and gray cells indicate a Z score <3.0. B shows the gene regulation network drawn by combining data relative to the estrogen-responsive transcriptome, TFBS matrix overrepresentation analysis of estrogen-responsive gene promoters, and ERα binding data in MCF-7 cells. Expression of the genes encoding transcription factors AP-2γ, E2F1 and 2, MYB, and RARα is enhanced by estrogen, whereas that of BATF, ELF3, GTF2IRD1, HES1, SMAD3, and RXRα is inhibited. The gene clusters where TFBS matrices associated with these TFs are enriched are listed in the boxes in red when up-regulated by estrogen, green when down-regulated, and blue when biphasic. For E2F1 and E2F2 TFs, the number of target genes/clusters were omitted from the graphic outlay of the network for clarity.

