Figure 9.
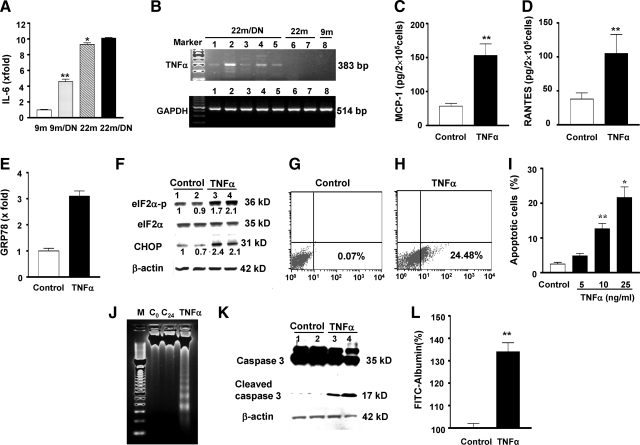
A: IL-6 expression: IL-6 mRNA levels were increased in 9-month-old diabetic (9m/DN) kidneys and further increased in 22-month-old nondiabetic (22m) and 22-month-old diabetic kidneys (22m/DN). **P < 0.01 versus 9m; *P < 0.01 versus 9m/DN. B: Representative gels of TNF-α and GAPDH mRNA levels of kidneys from 9-month-old (9m), 9-month-old diabetic (9m/DN, data not shown), 22-month-old (22m), and 22-month-old diabetic (22m/DN) mice. TNF-α mRNA expression was only found in the kidneys of 22-month-old diabetic mice (lanes 1 to 5). The expression was absent in 22-month-old (lanes 6 and 7) and 9-month-old (lane 8) mice even when PCR cycles were increased to 40. cDNA obtained from mouse macrophages (Mφ) was used as a positive control for PCR (data not shown). The levels of GAPDH mRNA were relative similar among the samples. C and D: TNF-α induced MCP-1 and RANTES protein production by proximal tubular cells. **P < 0.01 versus TNF-α alone. E: TNF-α increased GRP78 mRNA expression. GRP78 mRNA levels were measured by real-time PCR and corrected for β-actin mRNA levels. The levels in control cells were arbitrarily defined as 1. F: TNF-α increased eIF2α phosphorylation and CHOP. Proximal tubular cells were treated with TNF-α (25 ng/ml) for 12 hours. Total eIF2α was blotted using the same membrane after blotting with an antiphosphorylated eIF2α antibody. Lane 1 and 2: control cells; lanes 3 and 4: TNF-α-treated cells. G–I: TNF-α-induced apoptosis in proximal tubular cells. Proximal tubular cells in the presence of 10% FBS were treated with TNF-α (5 to 25 ng/ml) for 24 hours. Annexin V-positive cells in suspension or attached, counted by flow cytometry, are expressed as a percentage of total gated cells. Compared with control (G), TNF-α at a 25 ng/ml concentration caused 24.48% of cell death (H). Note that TNF-α at a 10 ng/ml concentration was sufficient to induce significant cell death (I). **P < 0.01 versus untreated control; *P < 0.01 versus cells treated with 10 ng/ml. J: DNA ladders. A representative agarose gel showing 2 μg of DNA from control (0 hour and 24 hours) and TNF-α (25 ng/ml for 24 hours) is depicted. M, 100-bp DNA marker; C0, DNA collected at 0 hour; C24, DNA collected at 24 hours; TNF-α, DNA collected at 24 hours after treatment. K: Caspase 3. Proteins were collected from control (lane 1 and 2) and TNF-α-treated (25 ng/ml for 24 hours, lanes 3 and 4) cells and examined by Western blots of total and cleaved caspase 3. The membranes was reblotted with an anti-β-actin antibody. L: TNF-α increased albumin permeability in podocytes. A monolayer of podocytes was created on the collagen-coated transwell filters in a 24-well plate. Some wells of cells were treated with TNF-α (20 ng/ml). FITC-labeled BSA was added to the cells. The amount of fluorescence BSA that passed through the cell layer was quantitated. Negative controls included unlabeled BSA or the filter without cells. The experiments were repeated three times. The result shown is the fluorescence intensity 2 hours after the addition of FITC-BSA. The value of albumin flux through monolayer without TNF-α was arbitrarily defined as 100%. **P < 0.01 versus control.

