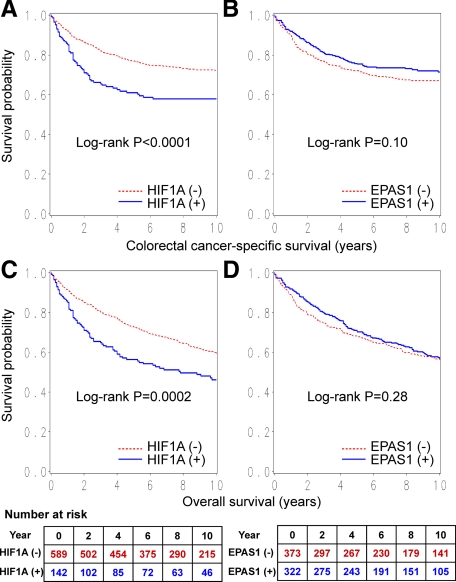
Figure 3.
Kaplan-Meier curves for colorectal cancer-specific survival (A and B) and overall survival (C and D) according to HIF1A status (A and C) or EPAS1 (HIF-2α) status (B and D) in colorectal cancer. Tables indicate the number of patients who were alive and at risk of death at each time point after the diagnosis of colorectal cancer.

