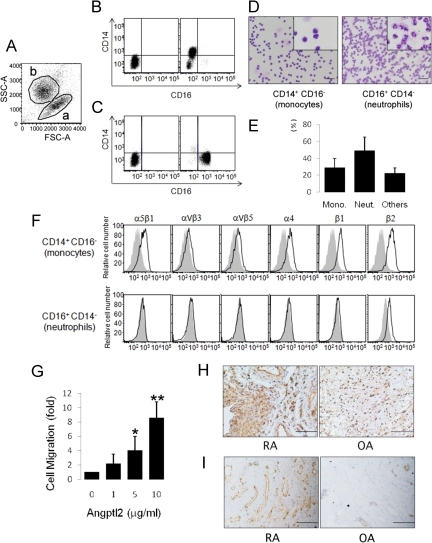
Figure 6.
Expression pattern of integrins in synovial fluid–derived monocytes and the Angptl2-induced monocyte migration activity. A: Total cells in RA synovial fluid were sorted for differences in size (forward scatter, FSC) and density (side scatter, SSC). This analysis identified two populations, indicated as a and b. B: FACS analysis of RA synovial fluid-derived cells in population a of A. C: FACS analysis of cells from population b of A. D: CD14+CD16− (left) and CD14−CD16+ (right) cells were sorted from RA synovial fluid and stained with Diff-Quick. Insets show high magnification of each panel. Scale bars = 50 μm. E: Percentages of each cell type in RA synovial fluid based on three independent experiments. Error bars indicate + SD F: A FACS analysis of CD14+CD16− monocytes (upper) and CD14−CD16+ neutrophils (lower) for integrin expression patterns. Shown are representative expression patterns using anti-integrin antibodies (black lines) or isotype-matched IgG (filled gray tracings) derived from three independent patients. G: A migration assay for synovial fluid–derived CD14+CD16− monocytes. H: Immunohistochemistry for Mac-2 in the RA and OA synovium. I: Immunohistochemistry for CD31 in the RA and OA synovium. Error bars indicate + SD. *P < 0.05, **P < 0.01, versus normalized migration rate in the absence of Angptl2.

