Figure 8.
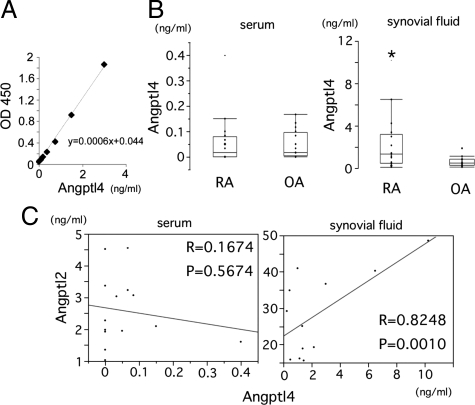
Correlation of full-length form of Angptl4 levels in RA synovial fluid with Angptl2 in RA synovial fluid. A: Standard curve obtained in the ELISA system for Angptl4. B: Angptl2 concentrations in serum (left graph) and synovial fluid (right graph) derived from RA (n = 14) and OA (n = 11) patients. C: No correlation was observed between the serum Angptl2 levels and the serum Angptl4 levels (left), but a positive correlation was seen between the synovial fluid Angptl2 levels and the synovial fluid Angptl4 levels (right).

