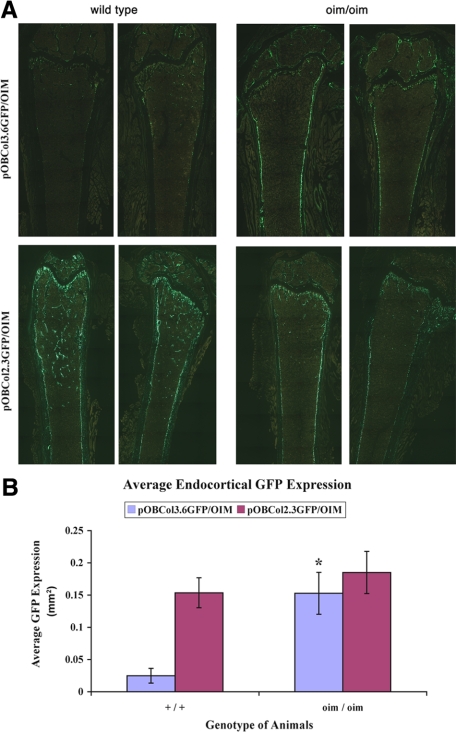
Figure 3.
Histological examination of GFP expression in vivo. A: Frozen sections of 3-month-old mouse femur. The upper panel shows 3.6GFP expression. Stronger and broader 3.6GFP expression can be detected on the endocortical surfaces of the femur of the oim/oim mice. The lower panel shows pOB2.3GFP expression. Note that the oim/oim mice have lower 2.3GFP expression in the trabecular area, whereas endocortical areas express GFP at similar levels in both +/+;2.3GFP and oim/oim;2.3GFP. B: Quantifications of the area of GFP-expressing cells in endocortical surfaces. Oim/oim;3.6GFP mice have a sixfold higher GFP expression area when compared with +/+;3.6GFP mice. No differences were detected in 2.3GFP expression on endocortical bone between +/+;2.3GFP and oim/oim;2.3GFP (*P < 0.05, n = 4 to 7).

