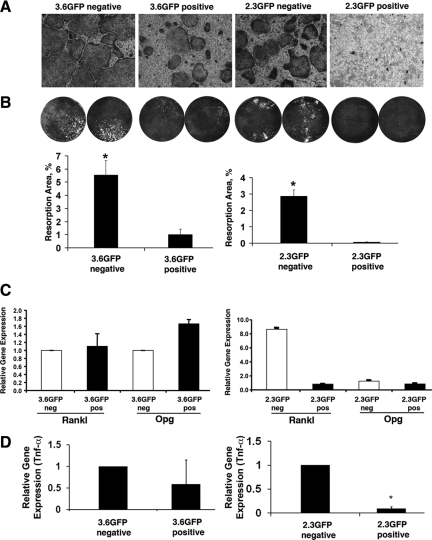
Figure 5.
Osteoclastogenesis induced by osteoblast lineage cells at different stages of differentiation. A: Representative images of cocultures of bone marrow–derived osteoclast progenitor cells (BMMCs) from +/+ mice with FACS-sorted osteoblasts at different stages of osteoblast lineage differentiation. A significantly higher osteoclast number was observed when BMMCs were cocultured with a 3.6GFP− or 2.3GFP− cell population (earlier stages of osteoblast lineage) compared with GFP+ osteoblasts. The most mature osteoblast lineage cells (2.3GFP+) exhibited very limited potential to induce osteoclastogenesis. B: Images and quantification of the area of osteoclast resorption pits on precoated osteologic plates. Significantly more resorption areas were detected in the cultures where osteoclast progenitors were cocultured with GFP− cells compared with GFP+ osteoblasts. C: Quantative real-time PCR analysis of Rankl and Opg expression level in osteoblasts along the osteoblast lineage. A 2.3GFP− population has a 15-fold higher Rankl/Opg gene expression ratio when compared with the 2.3GFP+ cells. D: Lower levels of TNF-α expression were detected in 3.6GFP+ compared with a 3.6GFP− population. In addition TNF-α expression was much lower in the most mature cells of the osteoblast lineage (2.3GFP+) when compared with 2.3GFP− population. Data presented are obtained from two independent biological experiments derived from sorted population of osteoblasts (*P < 0.05).

