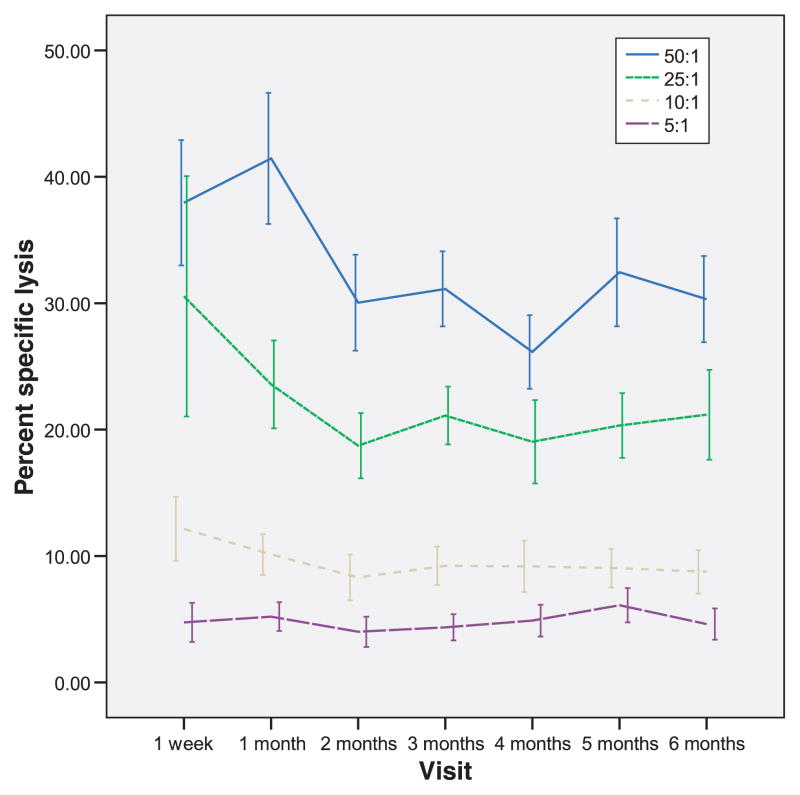
Fig. 2.
Graphs depicting percent specific lysis at four different effector: target ratios over time in postpartum women. As anticipated, the greatest lysis of Cr51 labeled K562 cells was achieved at the E:T ratio of 50:1, with minimal lysis observed at the lowest ratio of 5:1. These graphs are significantly different from each other, but over time the percent specific lysis does not differ significantly at any of the ratios.

