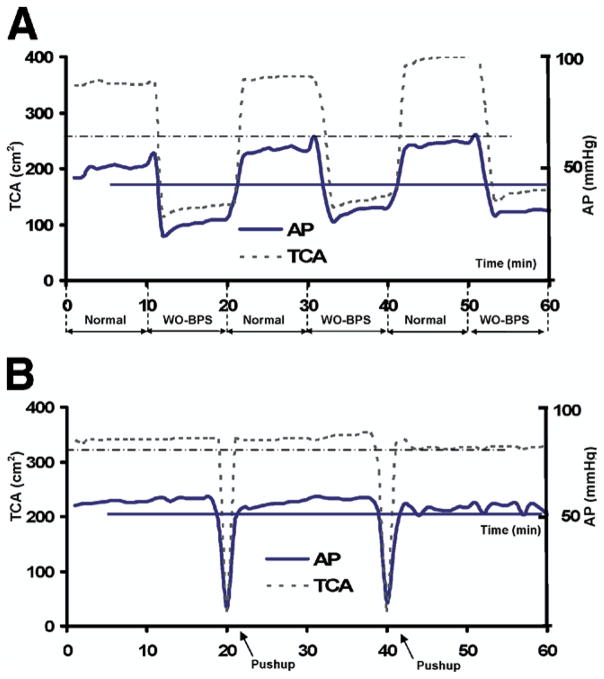
Fig 4.
Representative results of the alternate and normal plus pushup sitting protocols. Data are from 1 subject in the paraplegic group. (A) Average pressure (AP) and TCA on the posterior portion of the seat cushion during a trial of the alternate protocol. (B) Average pressure and TCA on the posterior portion of the seat cushion during a trial of the normal plus pushup protocol. NOTE. The horizontal lines indicate the average value over the entire 1-hour sitting trial.

