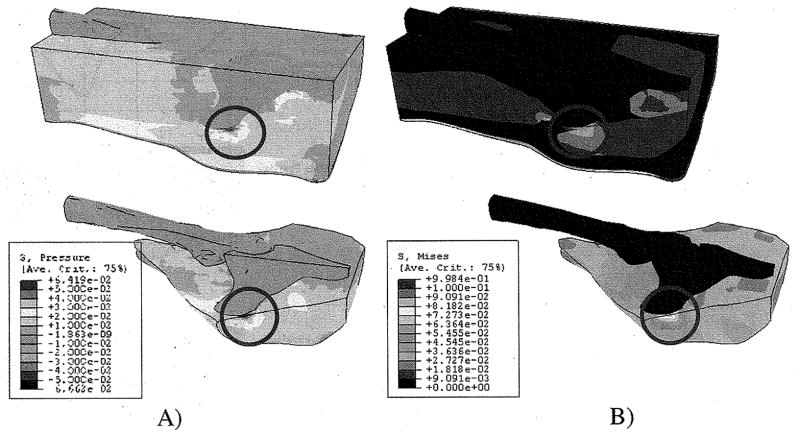
Fig. 9.
Internal pressure (A) and von Mises stress (B) distribution for the entire structure of the buttock–thigh. High pressure is identified in the fat and muscle in the region (circle in figure) immediately beneath the ischial tuberosity. (A) Internal pressure distribution. (B) von Mises stress distribution.

