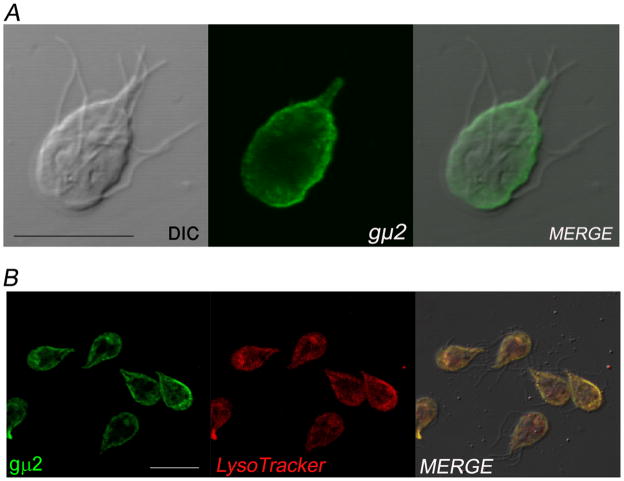
Figure 3. Subcellular distribution of gAP2.
(A) IFA and confocal microscopy show that gμ2 localizes predominantly to the peripheral vacuoles (PVs). (B) Live trophozoites were incubated with the lysosomal marker LysoTracker (red), fixed, labelled with anti-gμ2 mAb (green), and analyzed by confocal microscopy. The merged image shows colocalization (yellow) in the PVs. Some cells show colocalization in the bare zone. Bar, 10 μm.

