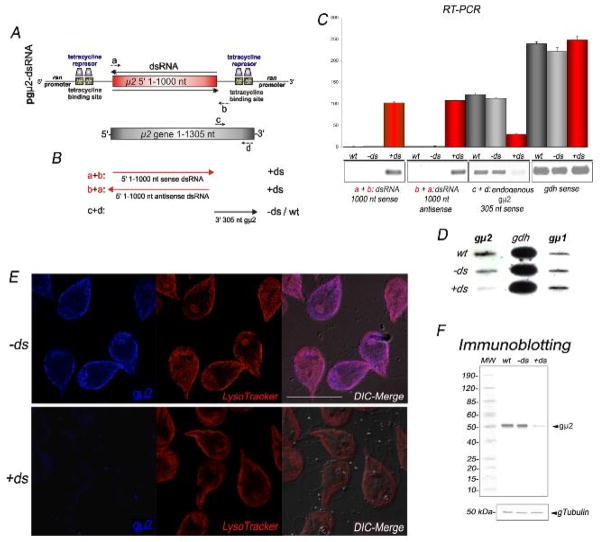
Figure 5. Depletion of gμ2 by long dsRNA production.
(A) Schematic representation of the pgμ2-dsRNA vector. After tetracycline induction, the dsRNA is produced under the control of the Giardia ran promoters. (B) Graphic of the endogenous gμ2 and the fragments detected by using the a, b, c, and d primer combinations. (C) Bars indicates densitometric assessment of one representative RT-PCR experiment. The same amount of 1,000 nt sense and antisense RNA from the vector is observed in +ds trophozoites. Reduction of endogenous gμ2 mRNA levels is observed in +ds but not in −ds or wild-type cells. Similar expression of gdh mRNA in wild-type, −ds and +ds cells is shown. wt: total RNA of wild-type trophozoites. −ds: trophozoites not expressing gμ2 dsRNA. +ds: trophozoites expressing gμ2 dsRNA. (D) Two micrograms of total RNA was used for a slot-blot assay. gμ2 depletion is observed only in +ds trophozoites by using the 3′-305-gμ2 antisense. gdh and gμ1 antisense probes are shown as controls. (E) Direct IFA and confocal microscopy confirms gμ2 depletion in +ds trophozoites (left bottom panel). LysoTracker staining in −ds and +ds cells is identical. Images were equally processed. Bars, 10 μm. (F) Immunoblotting using anti-gμ2 mAb demonstrates that gμ2 expression is reduced in +ds cells compared with −ds and wild-type (wt) cells (top panel). Uniform tubulin protein expression is observed in the reblotted membrane between wt, −ds, and +ds cells (input control) (bottom panel).

