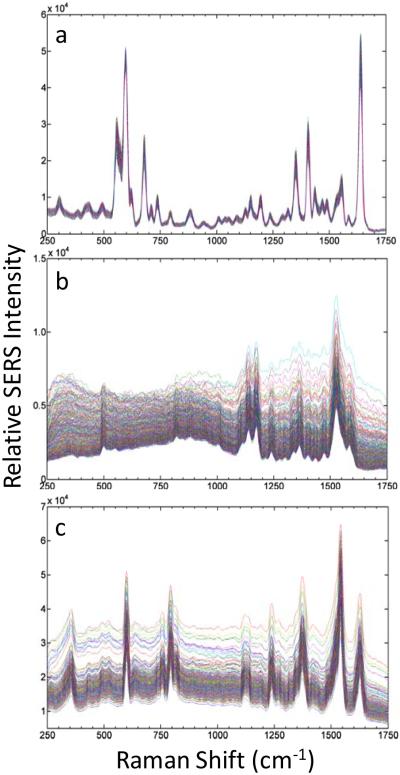
Figure 3.
Plot of spectra from 1000 single SERS-tags, taken with 50 mW of 514 nm excitation from: (a) Oxazine 170 tags; (b) Styryl 9M tags; (c) safranine tags (with 50 mW of 488 nm excitation). Integration time of 20 μs for each spectrum. A background spectrum from PBS has been subtracted from each single-tag spectrum.

