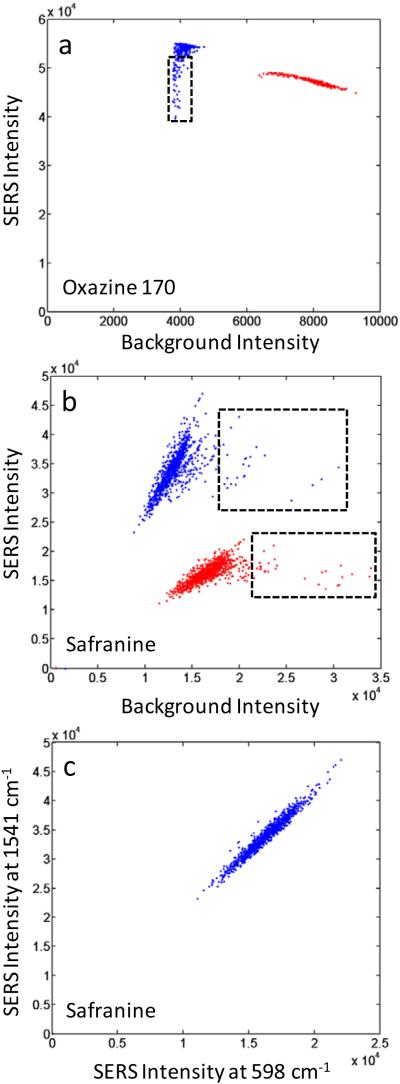
Figure 5.
Correlated Raman intensities at different frequencies for 1000 individual SERS-tag particles. (a) Oxazine 170, 1638 cm−1 peak compared to 1706 cm−1 background (blue) and 595 cm−1 peak compared to 642 cm−1 background (red); (b) Safranine, 1541 cm−1 peak compared to 1583 cm−1 background (blue) and 598 cm−1 peak compared to 534 cm−1 background (red); (c) Safranine, 1541 cm−1 peak compared to 598 cm−1 peak. Small subpopulations in behavior are highlighted by the dashed rectangles. Peak intensities are background-subtracted. Data extracted from the spectra of Figures 3a and 3c.

