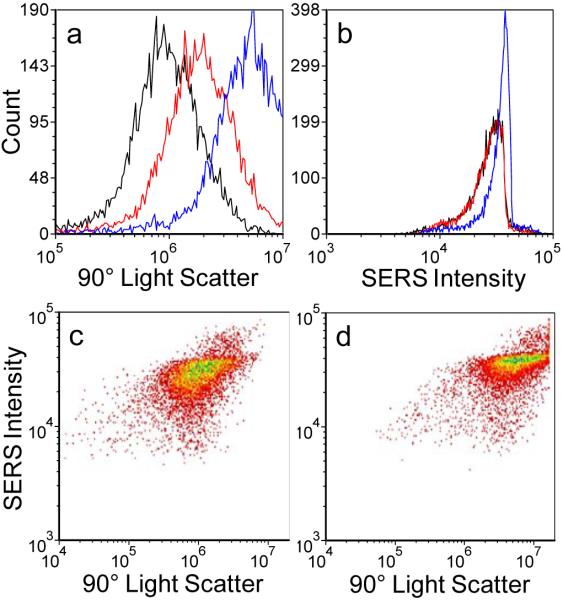
Figure 8.
Univariate histograms of: (a) Side scatter intensity; and (b) SERS intensity for approximately 8,000 safranine-labeled SERS-tags as a function of three different laser power levels: 1 mW (black), 1.5 mW (red), 3 mW (blue). For comparison, bivariate histograms for the same particle sets showing light scatter versus Raman signal for: (c) 1 mW laser power; (d) 3 mW laser power. Excitation at 532 nm, 250 μs integration time per particle. Color contours represent particle counts as per Figure 6.

