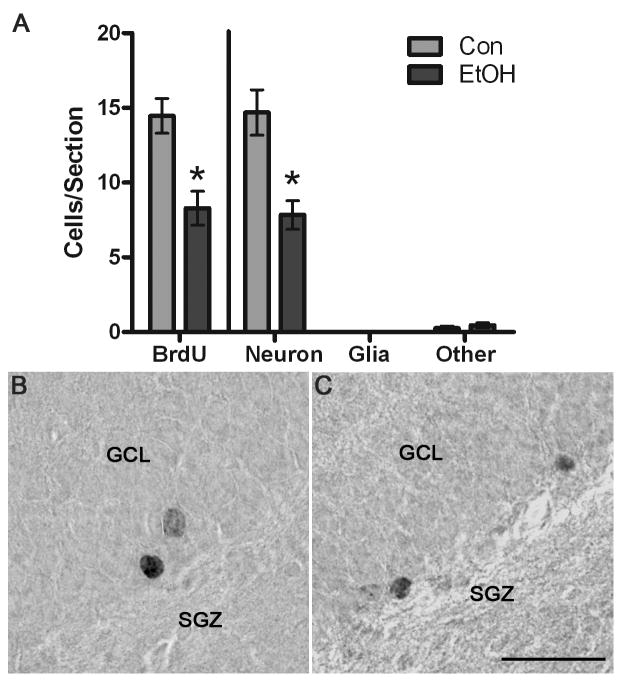
Figure 6.
BrdU+ cells remain significantly decreased 28 d after the last dose of alcohol. A) In the dorsal dentate gyrus granule cell layer and subgranular zone, there were significantly fewer BrdU+ cells in the alcohol-exposed tissue (n=4), as compared to controls (n=5) as shown on the left side of the graph. Because BrdU alone does not indicate cell type, BrdU+ cell numbers were multiple multiplied by the phenotype percentage data (Figure 5) to estimate effects on neurogenesis, which is shown in the right portion of the graph. Thus, the significant decrease in BrdU+ cells, yet similar phenotypes, result in significantly fewer neurons. Representative photomicrographs of BrdU+ cells labeled with DAB are shown for control tissue (B) and in alcohol-exposed tissue (C). Scale bar = 30 μm. *p< 0.05

