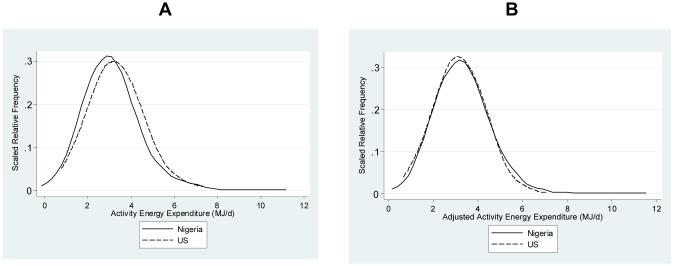
Figure 1.
A) Frequency distributions of activity energy expenditure (MJ.d−1) for the Nigerian cohort ( ) and the US cohort (---). The y-axis values correspond to the relative frequency scaled so that the total area under the curve equals 1, as in theoretical probability density functions.
B) Frequency distributions of activity energy expenditure adjusted for fat-free mass and fat mass (MJ.d−1) for the Nigerian cohort ( ) and the US cohort (---). The y-axis values correspond to the relative frequency scaled so that the total area under the curve equals 1, as in theoretical probability density functions.

