Figure 2.
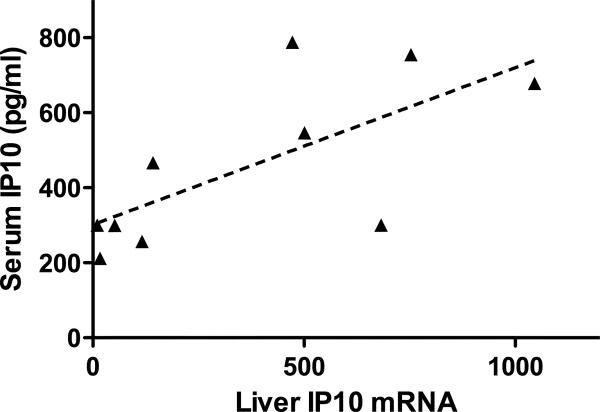
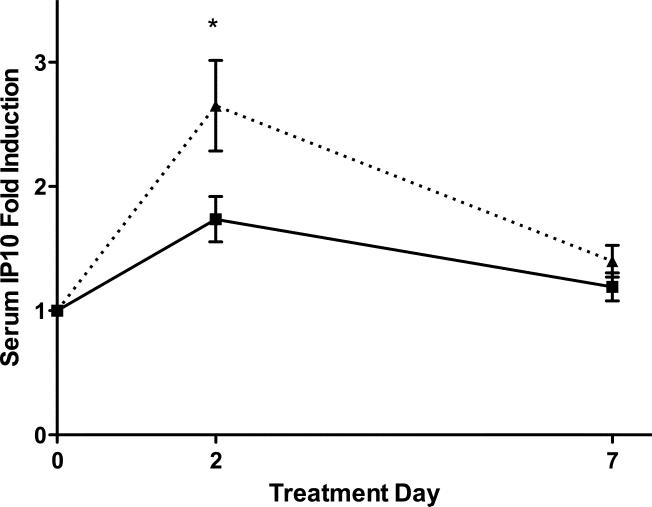
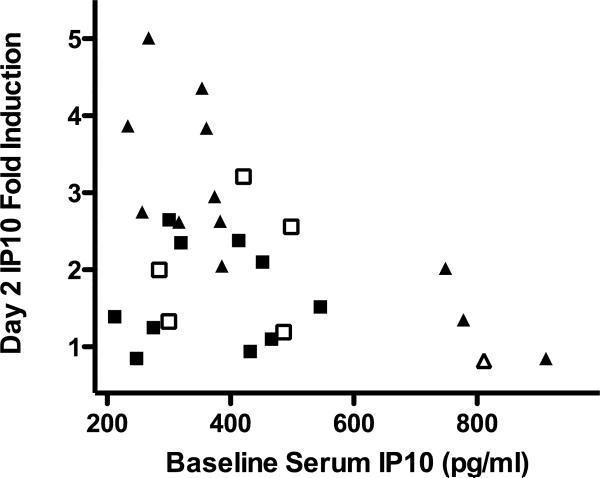
(a) Correlation of baseline serum IP-10 levels with liver IP-10 mRNA levels (normalized to GAPDH mRNA levels, arbitrary units). r2 = 0.489, p = 0.025. (b) Serum IP-10 level fold induction relative to day 0 for LD (solid line, squares) and SD (dashed line, triangles). * p<0.05. (c) Day 2 IP-10 induction vs. baseline levels. LD marked with squares, SD with triangles. Open symbols mark treatment failure and filled symbols mark SVR.


