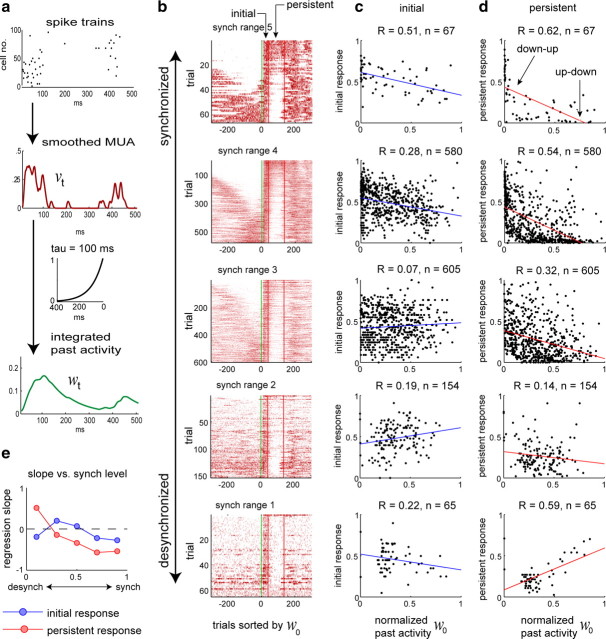
Figure 2.
Persistent activity correlates with past activity in a state-dependent manner. a, Schematic of how we obtain a smoothed MUA trace (v; red) and integrated past activity trace (w; green) from recorded spikes. b, Population responses to click stimuli. Trials from four different recording sessions were pooled and divided into five groups corresponding to different levels of synchronization (see Materials and Methods). Each box shows a pseudocolor representation of MUA rate (v; red) for each trial within the corresponding synchronization range, with trials within each box sorted according to the value of the past activity variable w at the time of stimulus onset. c, d, For each trial, the strengths of the initial and persistent responses to the click were quantified by counting spikes in the period 10–35 and 40–135 ms poststimulus, respectively. Each box shows the correlation of response strength with prior activity w, for the corresponding synchronization range. Note that initial, persistent, and past activity values have all been normalized to better compare across recordings (see Materials and Methods). In highly synchronized states (top row), the persistent response is anticorrelated with past activity; this correlation grows weaker and eventually reverses with increasing desynchronization. Initial response shows less correlation with past activity than does persistent response. e, Regression slopes for initial and persistent responses as a function of synchronization range. synch, Synchronized; desynch, desynchronized.

