
Figure 4.
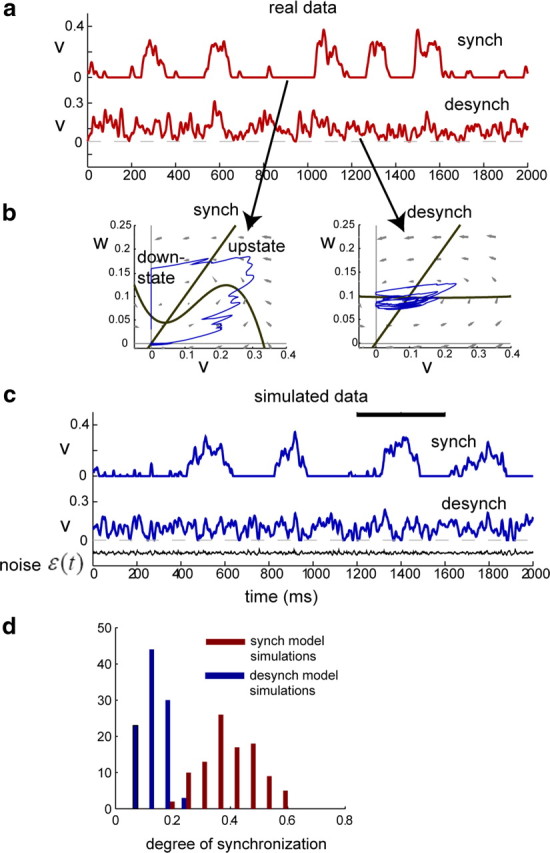
Spontaneous activity simulated via the model. a, Two seconds of real data from synchronized (top) and desynchronized (bottom) states within the same recording session. b, Model fits for the data in a. When the model is fit on the synchronized data (left), the resulting phase diagram is highly nonlinear and consistent with dynamics that alternate between downstates and transient upstates. In contrast, when the model is fit on desynchronized data (right), the resulting phase diagram is nearly linear and reflects a stable baseline firing rate with fluctuations about the mean (fixed point). Trajectories for simulated data (blue) are superimposed on the phase diagrams, taken from the time interval denoted by the black bar in c. c, Using the model fits in b, we generated simulated spontaneous activity by driving each model with noise (see Materials and Methods). The same randomly generated noise input (black) produces very different simulated activity for synchronized and desynchronized model fits; the simulated data qualitatively resembles the real data in a. d, The analysis in c was repeated for 100 randomly generated filtered noise sequences of length 3 s. For each data segment simulated from one of the model fits in b, the degree of synchronization was computed based on the MUA power spectrum, independently of the model parameters (see Materials and Methods). Data segments produced by the model fit to (de)synchronized data consistently exhibited power spectra characteristic of (de)synchronized experimental recordings. synch, Synchronized; desynch, desynchronized.