
Figure 1. Route of Infection Controls T Cell Activation in the Lung Airways.
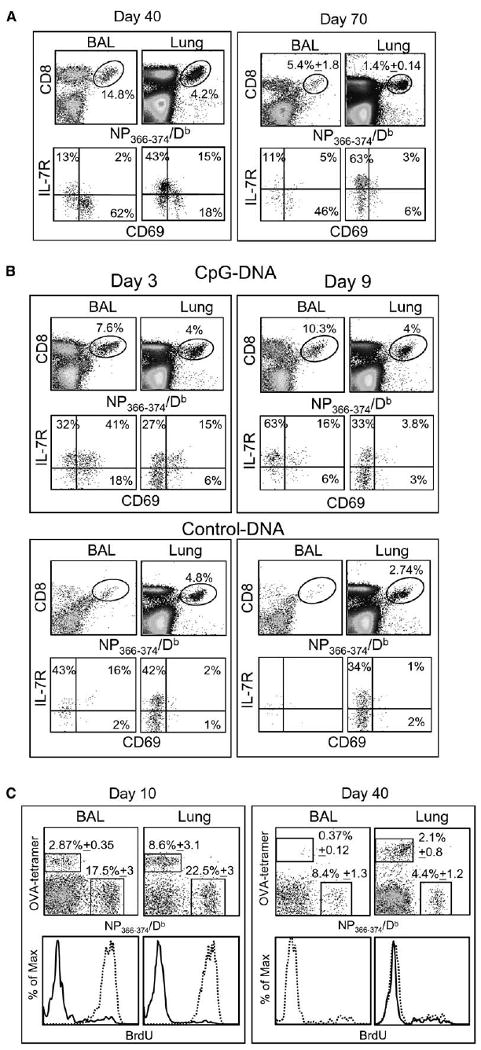
(A) C57BL/6 mice were given 300 EID50 HKx31 influenza virus by i.n. infection. On days 40 and 70 after infection, NP366–374/Db-specific CD8 T cells in the BAL and parenchyma (Lung) were counted and analyzed for CD69 and IL-7R expression. Percentages of NP366–374/Db-specific cells within the total CD8 T cell populations are shown.
(B) Mice were given 5000 EID50 HKx31 influenza virus by i.p. injection. One month later, the mice were treated with 15 μg CpG or control ODN-DNA in the lungs. Gated populations of NP366–374/Db-specific CD8 T cells were analyzed for CD69 and IL-7R expression on days 3 (left) and 9 (right) after ODN-DNA treatment.
(C) Mice were primed with LM-OVA i.v. and 1 month later infected with HKx31. Groups of five mice were fed with BrdU water between days 0 and 10 or 30 and 40 after infection. Lymphocytes from the BAL and lung parenchyma were analyzed for NP366–374/Db- and OVA-specific CD8 T cells at the end of the BrdU treatment. Overlaid histograms show BrdU content in gated populations of NP366–374/Db- (dashed lines) and OVA-specific (continuous lines) CD8 T cells. Error bars represent the SEM from five mice.