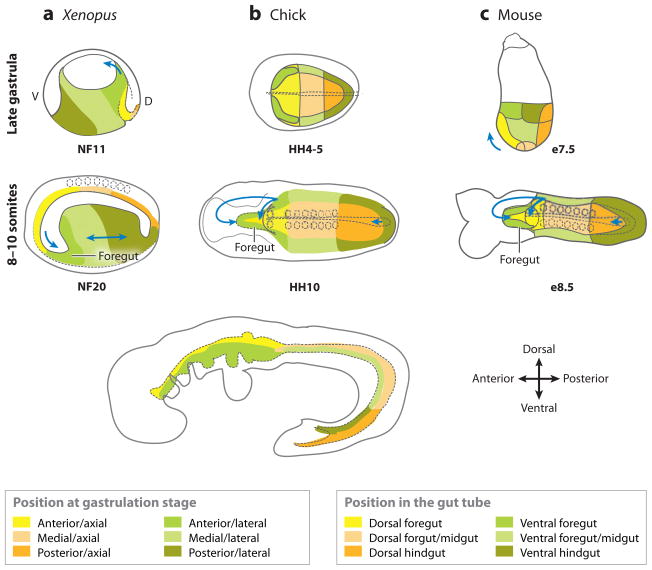
Figure 3.
Fate maps of (a) Xenopus, (b) chick, and (c) mouse embryos from the late gastrula to the early-somite stage. The (top panels) that show late-gastrula stage in the Xenopus (NF11) and mouse (e7.5) are a lateral view; and the chick (HH4) is a ventral view. The (dotted line) in the chick shows the developing notochord. The colored domains roughly correspond to the fate-map studies. The Xenopus embryos are depicted in mid-saggital section. The (middle panels) are a ventral view of 8–10 somite stage embryos. The (arrows) indicate the folding/migration direction of the foregut and hindgut; the (dotted circles) are somites; the (dotted line) along the midline is the notochord; and the (dotted line) in the anterior outlines the developing foregut. The (bottom panel) is a schematic showing a lateral view of an E9.5 mouse embryo. The colored domains shown at the bottom indicate the domains of the gastrula-stage embryos that roughly correspond with the equivalent domains of the gut tube. A, anterior; P, posterior; d, dorsal; v, ventral.

