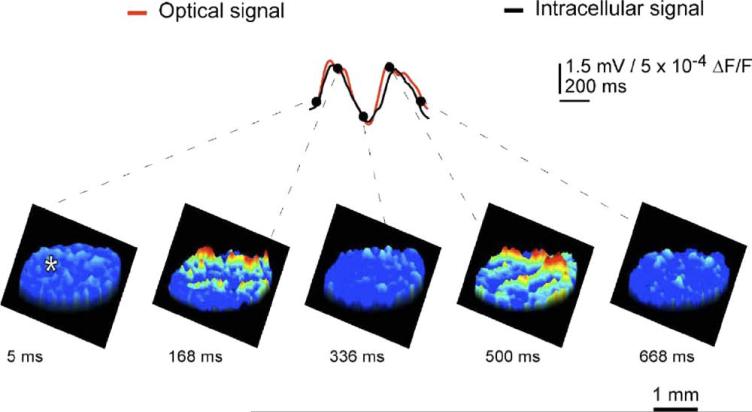
Fig. 1.
IO. Spontaneous oscillatory electrical activity was acquired simultaneously using optical voltage imaging and intracellular recording. The beginning of oscillatory sequence was defined as 0 ms. The upper panel superimposed the optical signal in red and intracellular voltage recording (asterisk) in black demonstrate temporal waveform coherence. The lower panels illustrate the spatial distribution of voltage imaging at five different time points indicated by dots in the upper panel from two successive oscillation cycles averaged three times over the oscillatory sequence. Note that ensemble oscillations emanated from several fluorescent clusters of coherent activity, and that the spatial and temporal structure of the IO cluster activity is discernable directly from cluster distribution and size. Time voltage and spatial distribution are as indicated by the calibration bars (modified from; Leznik and Llinas, 2005).

