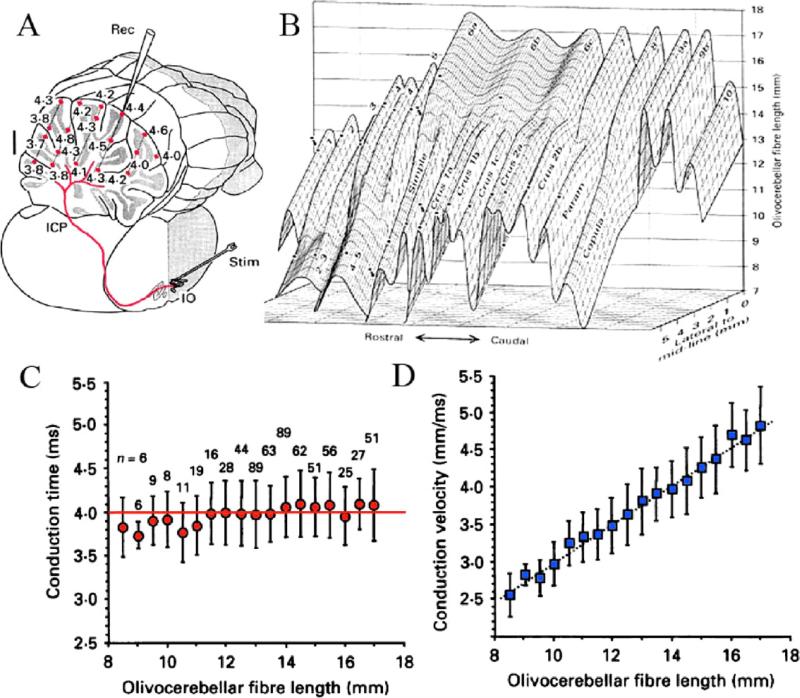
Fig. 2.
Olivo-cerebellar conduction time constancy throughout the extent of the cerebellar cortex. (A) Diagram of the path for a single climbing fiber (red). Microelectrode recorded PC complex spike latency at different depths (red dots) is shown in ms following IO electrical stimulation. (B) Tridimensional representation of CF length. The X and Z coordinates indicate, respectively, rostrocaudal/mediolateral CF localization in the different folia (indicated) and the Y-coordinate the CF length. (C) Conduction time is plotted against CF length (4 ms [variance±500 μs]). (D) Conduction velocity related linearly to length (modified from Sugihara et al., 1993).

