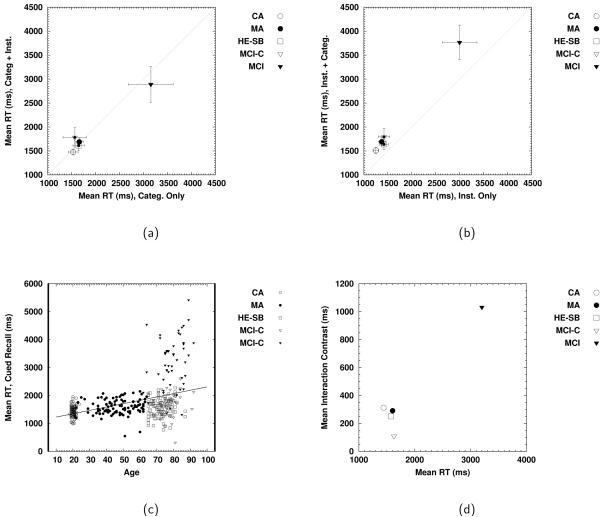
Figure 7.
(a) Mean RTs for single- and double-cue cued recall trials, given that the single cue was a category cue; (b) mean RTs for single- and double-cue cued recall trials, given that the single cue was an instance cue; (c) mean RTs overall per participant as a function of age; (d) interaction contrast (see Equation 9) for the interaction of single-cue condition and number of cues for each group, relative to the overall mean RT for that group.

