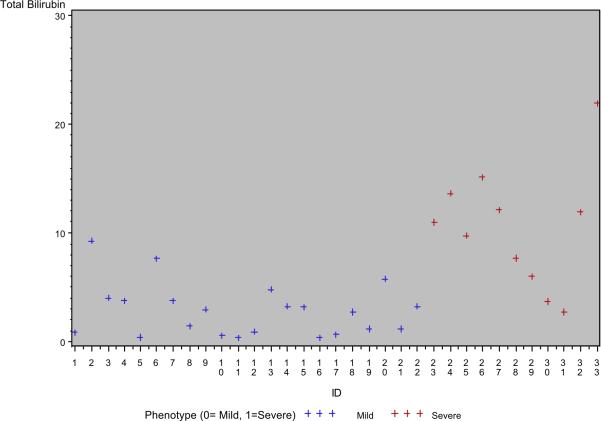
Figure 1. Scatter Plots of Highly Significant Variables.
Each cross represents the mean of the serial laboratory values from birth to 5 years for an individual patient. Red crosses represent patients from the severe outcome group and black crosses represent patients from the mild outcome group. Total bilirubin, conjugated bilirubin and cholesterol are expressed as mg/dL along the y-axis of each plot.

