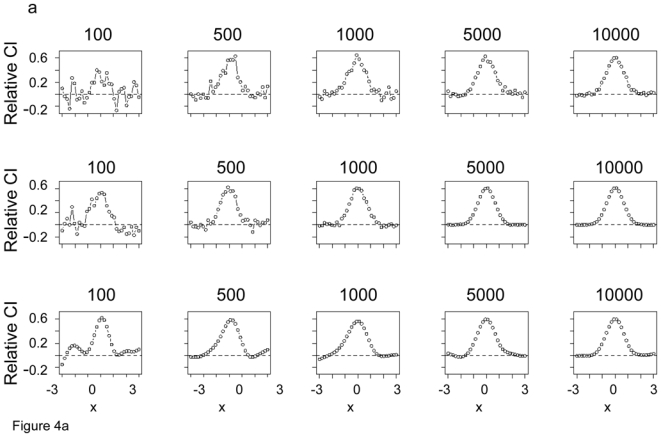
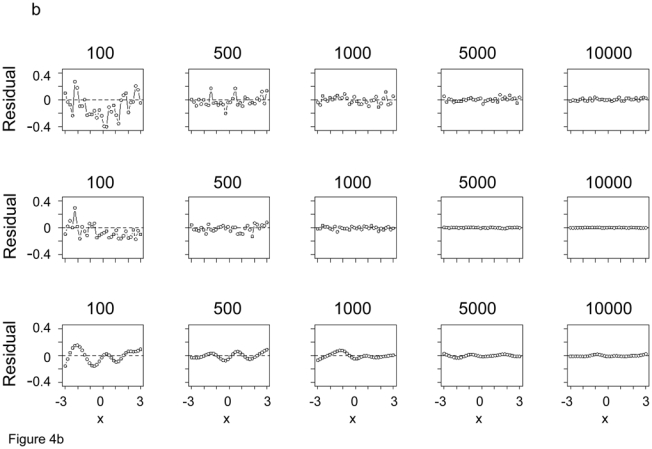
Figure 4.


a. Examples of estimates of the classification image (unnormalized) obtained with LM (first row), GLM (second row), and GAM (third row) as a function of number of trials, 100, 500, 1000, 5000, 1000. The results for the third row will be discussed later, after presentation of GAM, but are included here to facilitate comparison across all three models. b. The residuals from the template after normalization corresponding to each plot in Figure 4a.
