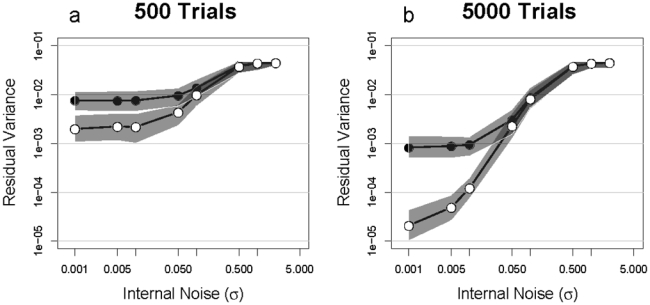
Figure 5.

Residual variance between estimated classification image and the template is plotted as a function of the standard deviation of the Gaussian noise added to the template. Each point is the median of 100 repetitions and the grey regions correspond to 95% confidence intervals. The black points correspond to fits with LM and the white, with GLM. a. Each run is 500 trials. b. Each run is 5000 trials.
