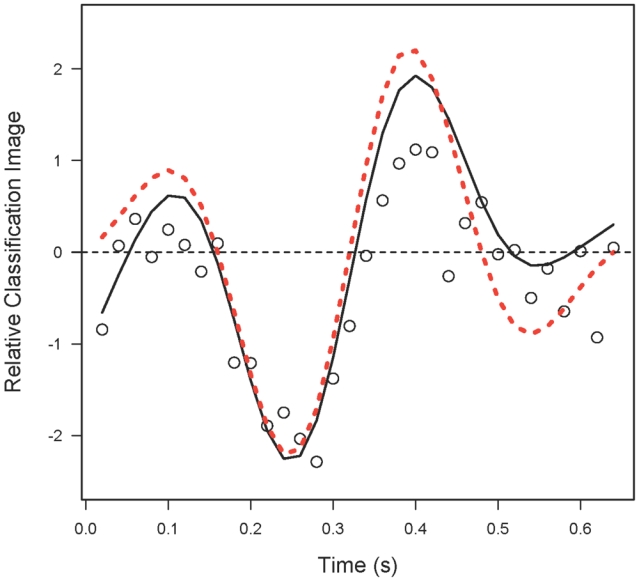
Figure 6.

The solid black line indicates the classification image as a function of time, estimated using a GAM. The red dashed curve is the ideal template as in Figure 2a,b. The white circles correspond to the GLM classification image replotted from Figure 2d.
