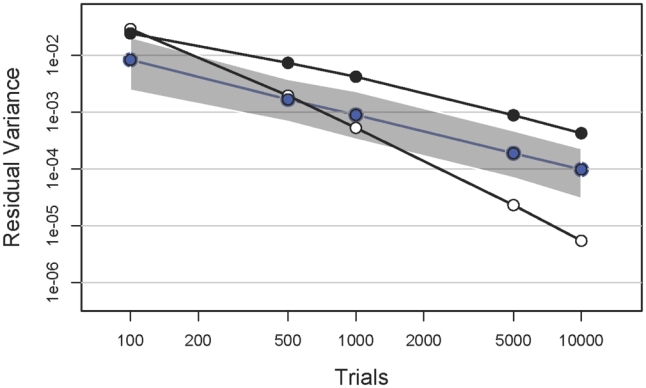
Figure 7.

The residual variance between the classification image and the template is plotted as a function of the number of trials. The blue points and line segments correspond to the median values of 100 experiments from the GAM fits and the grey regions are the 95% confidence interval. The black and white points correspond to the LM and GLM models, respectively, and are replotted from Figure 3
