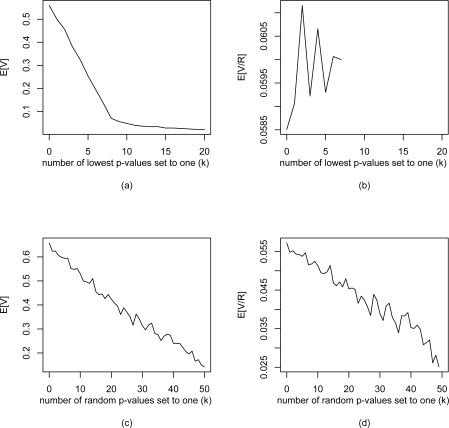
Figure 3:
Results of simulations assessing performance of FDR-MSA. Shown above are (a, c) expected number of false positives (E[V]) and (b, d) expected False Discovery rate (E[V/R] versus the number of original adjusted p-values (k) set to one. The k p-values are selected by (a, b) taking the k lowest adjusted p-values, and by (c, d) selecting k random p-values

