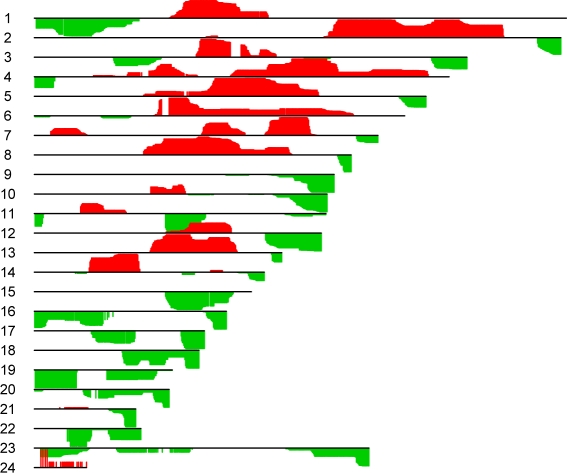
Figure 5:
Sparse mCCA was performed on the DLBCL copy number data, treating each chromosome as a separate “data set”, in order to identify genomic regions that are coamplified and/or codeleted. The canonical vectors w1, ..., w24 are shown. Positive values of the canonical vectors are shown in red, and negative values are in green.

