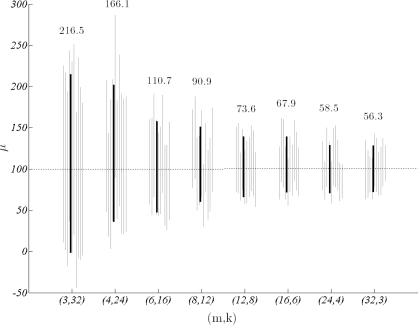
Figure 1:
95% credible intervals of μ for data sets with m = 3, 4, 6, 8, 12, 16, 24, 32 loci and k = 32, 24, 16, 12, 8, 6, 4, 3 alleles respectively, all generated under σ = 100. For each parameter vector the mean credible interval based on thirty replicates (black) and ten individual intervals are shown (shades). Interval lengths for means are given on top.

