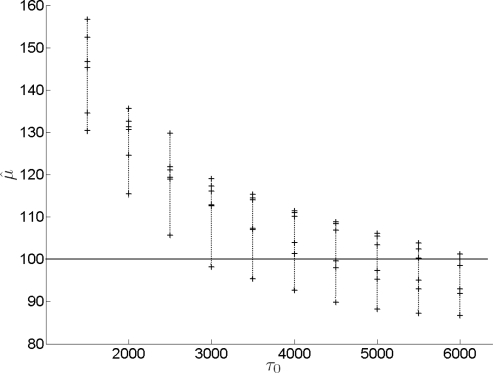
Figure 5:
Mean μ̂ for a range of τ0 for data with increasing number of loci (k = 10 constant). For each τ0, marks indicate estimates for (from top to bottom) m = 5, 10, 15, 20, 25, 30. Each estimate is the mean of 10 data sets. The unbiased point estimates corresponding to the given number of loci are obtained respectively at optimal τ0 = 6100, 6000, 5500, 4450, 4100, 2850 (not shown).

