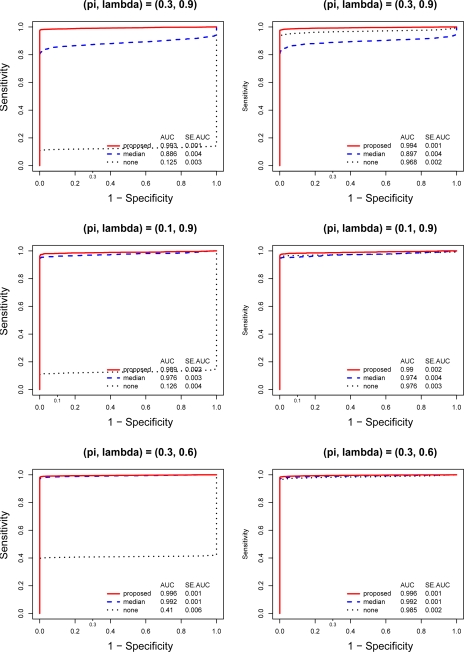
Figure 2:
ROC curves for the posterior probability based on the proposed normalization and the two-sample t-test p-values following no or median normalizations. True array effects are non-randomized for the left panels and randomized for the right panels. From top to bottom, (π, λ) are (30%, 90%), (10%, 90%), and (30%, 60%).

