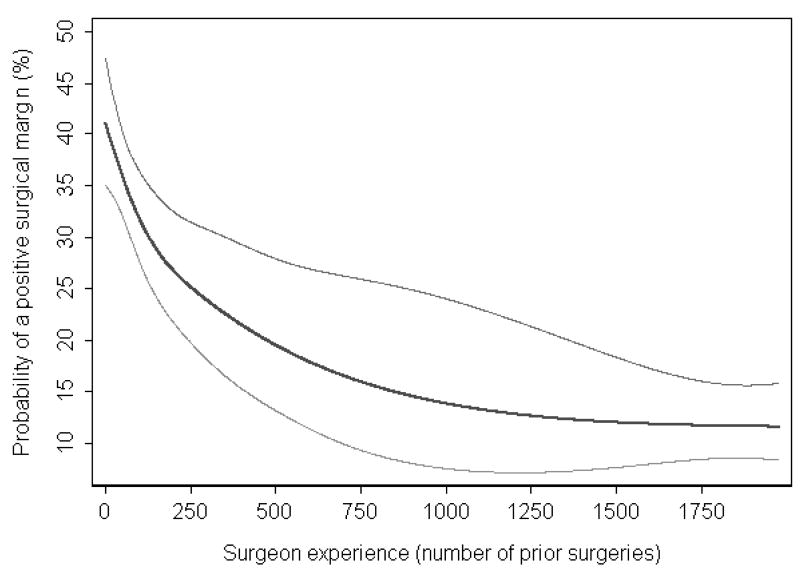
Figure 1. The surgical learning curve for a positive surgical margin.
Predicted probability (black curve) and 95% confidence intervals (gray curves) of a positive surgical margin are plotted against increasing surgical experience. Probabilities are for a patient with typical cancer severity (mean prostate-specific antigen level, pathologic stage, and grade) treated in 1997 (approximately equal numbers of patients were treated before and after 1997).

