Figure 3.
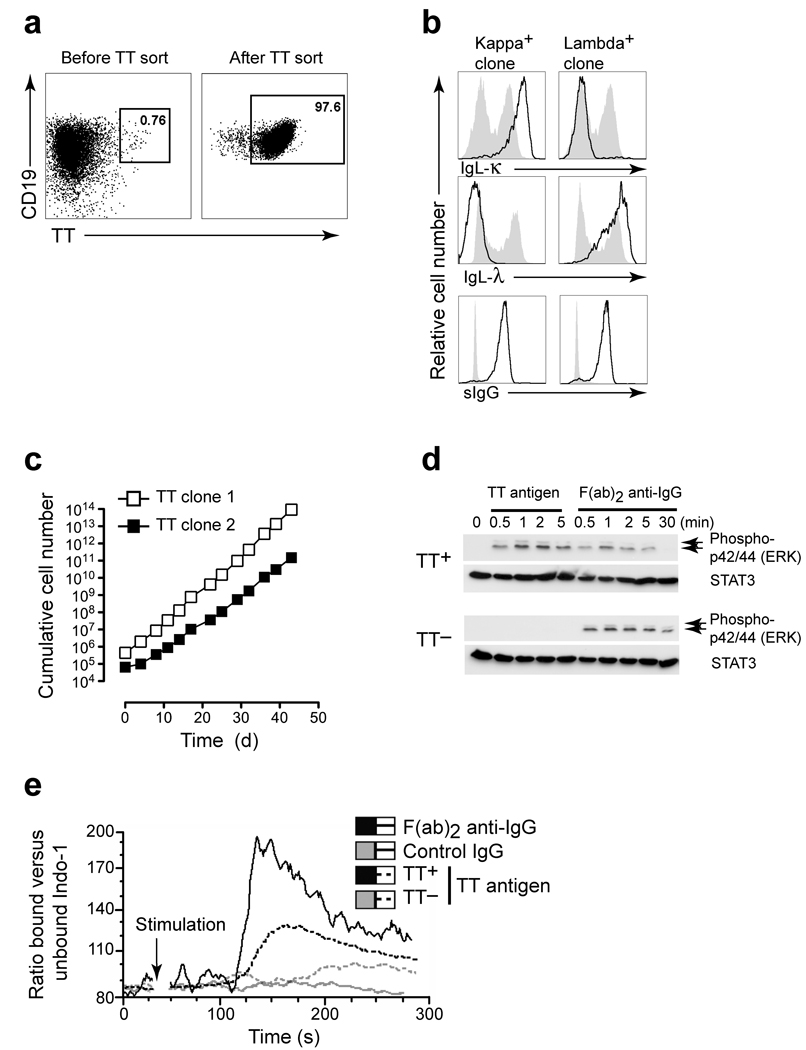
Generation and characterization of Tetanus toxoid (TT)-specific monoclonal human B cell lines. (a) Cell sorting of TT-specific B cells from bulk CD19+ BCL6+Bcl-xL transduced memory B cell culture using TT-PE staining. (b) Monoclonal cell lines express surface IgG and are either IgL-λ or IgL-κ light chain positive. Shaded histograms are CD19+ tonsil B cells. (c) The cumulative cell number (as in Fig. 1c) of two representative B cell clones in time. (d) TT-specific and control TT negative cell lines were incubated with TT or F(ab)2 -human IgG antibody stimulation and phospho-ERK1/2 was determined by immunoblot analysis. STAT3 blotting was used to verify equal loading. Results are representative of two experiments (e) Calcium flux in TT specific IgG positive B cell lines. Cells were loaded with Indo-1 AM and were subsequently stimulated with TT (dashed black trace), IgG F(ab)2 antibody (solid black trace), or control IgG (solid grey trace). The Indo-1 response of a TT-negative clone stimulated with TT antigen is shown as an antigen specificity control (dashed grey trace). Shown is the ratio bound versus unbound Indo-1. Results are representative of three experiments.

