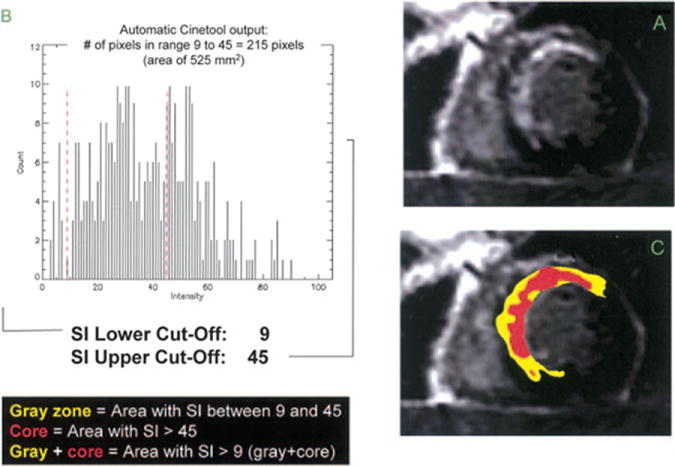
Figure 5.

A short axis late gadolinium enhancement (LGE) image from a patient with anterior infarction (panel A) where the extent of the gray zone was calculated as the area with signal intensity (SI) between maximum SI from normal remote myocardium and 50% of maximum LGE SI and is highlighted in yellow (panel C). In this example, the peak SI in normal remote myocardium is 9, therefore abnormal enhancement was considered in areas with SI greater than 9. A histogram of SI in the region of LGE (panel B) shows a maximum SI of 90, so that the upper limit of SI for the gray area is 50% of 90, or 45. The core area of LGE is highlighted in red (panel C) and is defined as the area with SI greater than 50% of maximum. In this example, the core area of LGE has a SI greater than 45. Reproduced with permission from Schmidt A, Azevedo CF, Cheng A, et al. Infarct tissue heterogeneity by magnetic resonance imaging identifies enhanced cardiac arrhythmia susceptibility in patients with left ventricular dysfunction. Circulation. 2007;115:2006-2014.
