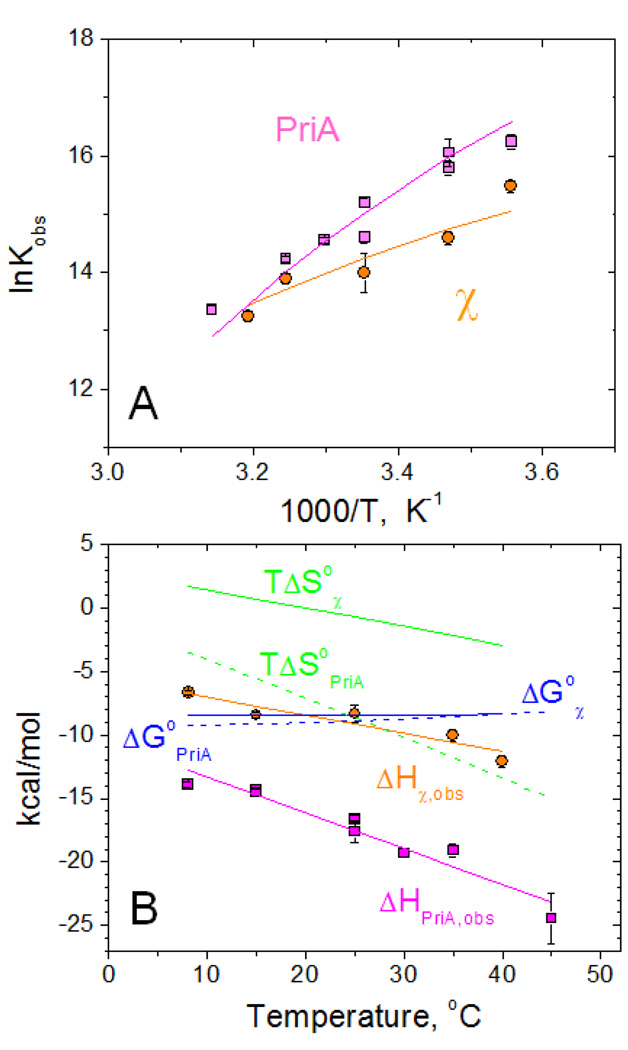
Figure 3.
Temperature dependence of the interaction of PriA and χ with SSB-Ct peptide (WP9) performed in low salt conditions (20 mM NaCl) in buffer C (10mM Cacodylate, pH 7.0, 25% glycerol)
(A) – van't Hoff plots of the dependences of Kobs on temperature for PriA (magenta squares) and χ (orange cirles).
(B) - Temperature dependences of thermodynamic parameters: ΔHobs (PriA – magenta squares and χ - orange circles), ΔG°obs (blue dashed and solid lines for PriA and χ, respectively) and TΔS°obs (green dashed and solid lines for PriA and χ, respectively)
Solid lines (magenta for PriA and orange for χ ) through the experimental points in panels A and B represent global fits of the data to eqs 2–3 (see Materials and Methods) with the following parameters: Kobs,25°C=(3.4±0.6)×106 M−1, ΔHobs,25°C = −17.6±0.2 kcal/mol and ΔCpobs= −281±21 cal/mol deg for PriA and Kobs,25°C =(1.6±0.4)×106 M−1, ΔHobs,25°C = −9.2±0.3 kcal/mol and ΔCpobs= −143±21 cal/mol deg for χ. The dependences of ΔG°obs and TΔS°obs shown in panel B were simulated using ΔG°obs=−RTlnKobs and TΔS°obs=ΔHobs − ΔG°obs.

