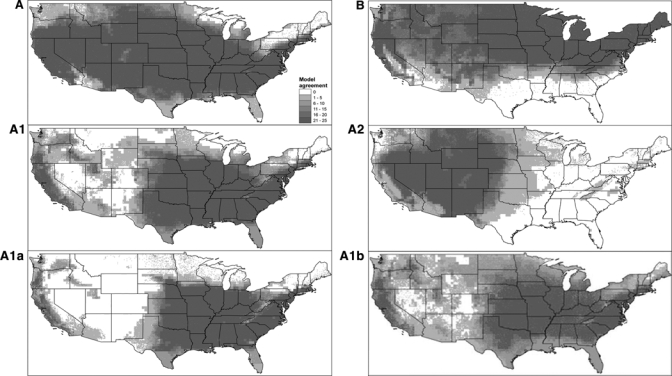
Figure 2.

Potential distribution maps for six tularemia genotypes in the United States. White indicates predicted absence, whereas darker shades correspond to higher model agreement in predictions of potential for presence among the 25 replicate models.
