
Figure 4.
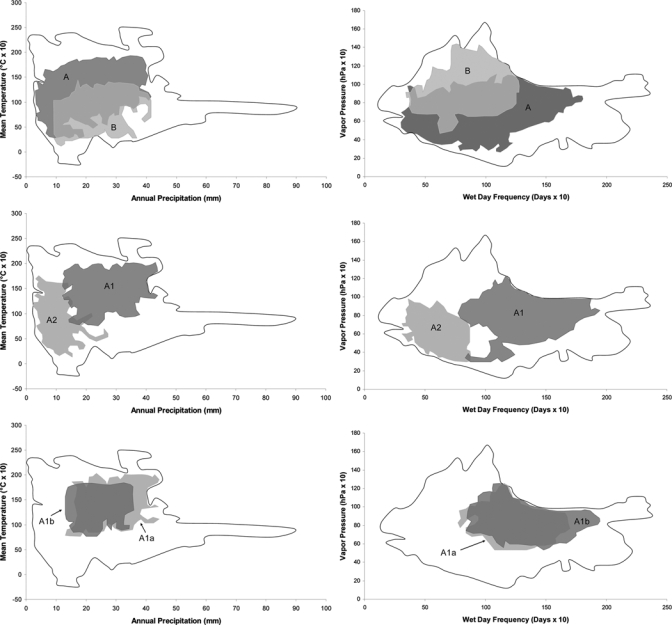
Scatter plots comparing distributions of F. tularensis genotypes in ecological space based on pairs of environmental variables. Polygons outline the distribution of the general environmental characteristics across the United States.
Official websites use .gov
A
.gov website belongs to an official
government organization in the United States.
Secure .gov websites use HTTPS
A lock (
) or https:// means you've safely
connected to the .gov website. Share sensitive
information only on official, secure websites.
Scatter plots comparing distributions of F. tularensis genotypes in ecological space based on pairs of environmental variables. Polygons outline the distribution of the general environmental characteristics across the United States.