
Figure 5.
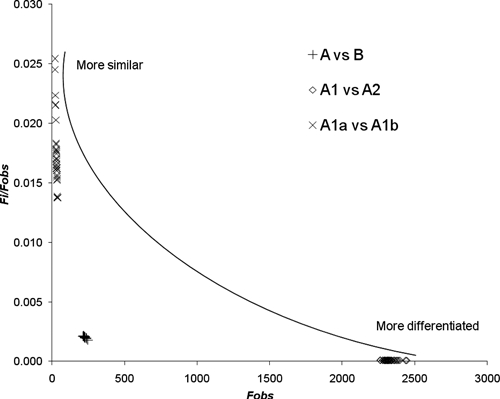
Scatter plot of the values of the F*/Fobs ratio and the Fobs calculated from the non-parametric MANOVA. Values toward the lower right corner show greater differentiation between the compared genotypes, and values toward the upper left corner show more ecological similarity.